From stories to statistics, use the power of engaging infographics
A month has gone by since ADMA’s Data Day – so we thought it’s time to bring back the highlights of this event.
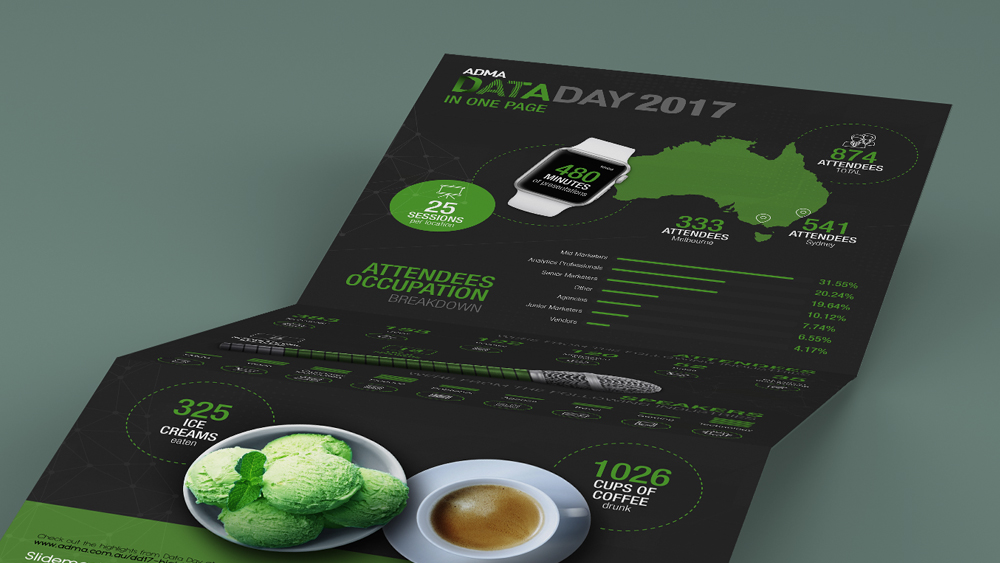
To give you an example of how to bring statistics to life and to efficiently communicate complex data, our creative team has designed an engaging infographic on DATA DAY.
Our designers transform factual information into an eye-catching and easily digestible diagram that any audience will love.
Utilizing interesting statistics and bright illustrations, we create high-impact infographics that can easily be printed, published online and distributed via social media.